【Matplotlib】アニメーション(FuncAnimation)
こんにちは
今日はMatplotlibのFuncAnimationを使ってアニメーションを作成したいと思います。
グラフ作成
Step1
まずはドキュメントの3個目のsin関数を描写してみましょう。
Step2
ドキュメントを参考にして
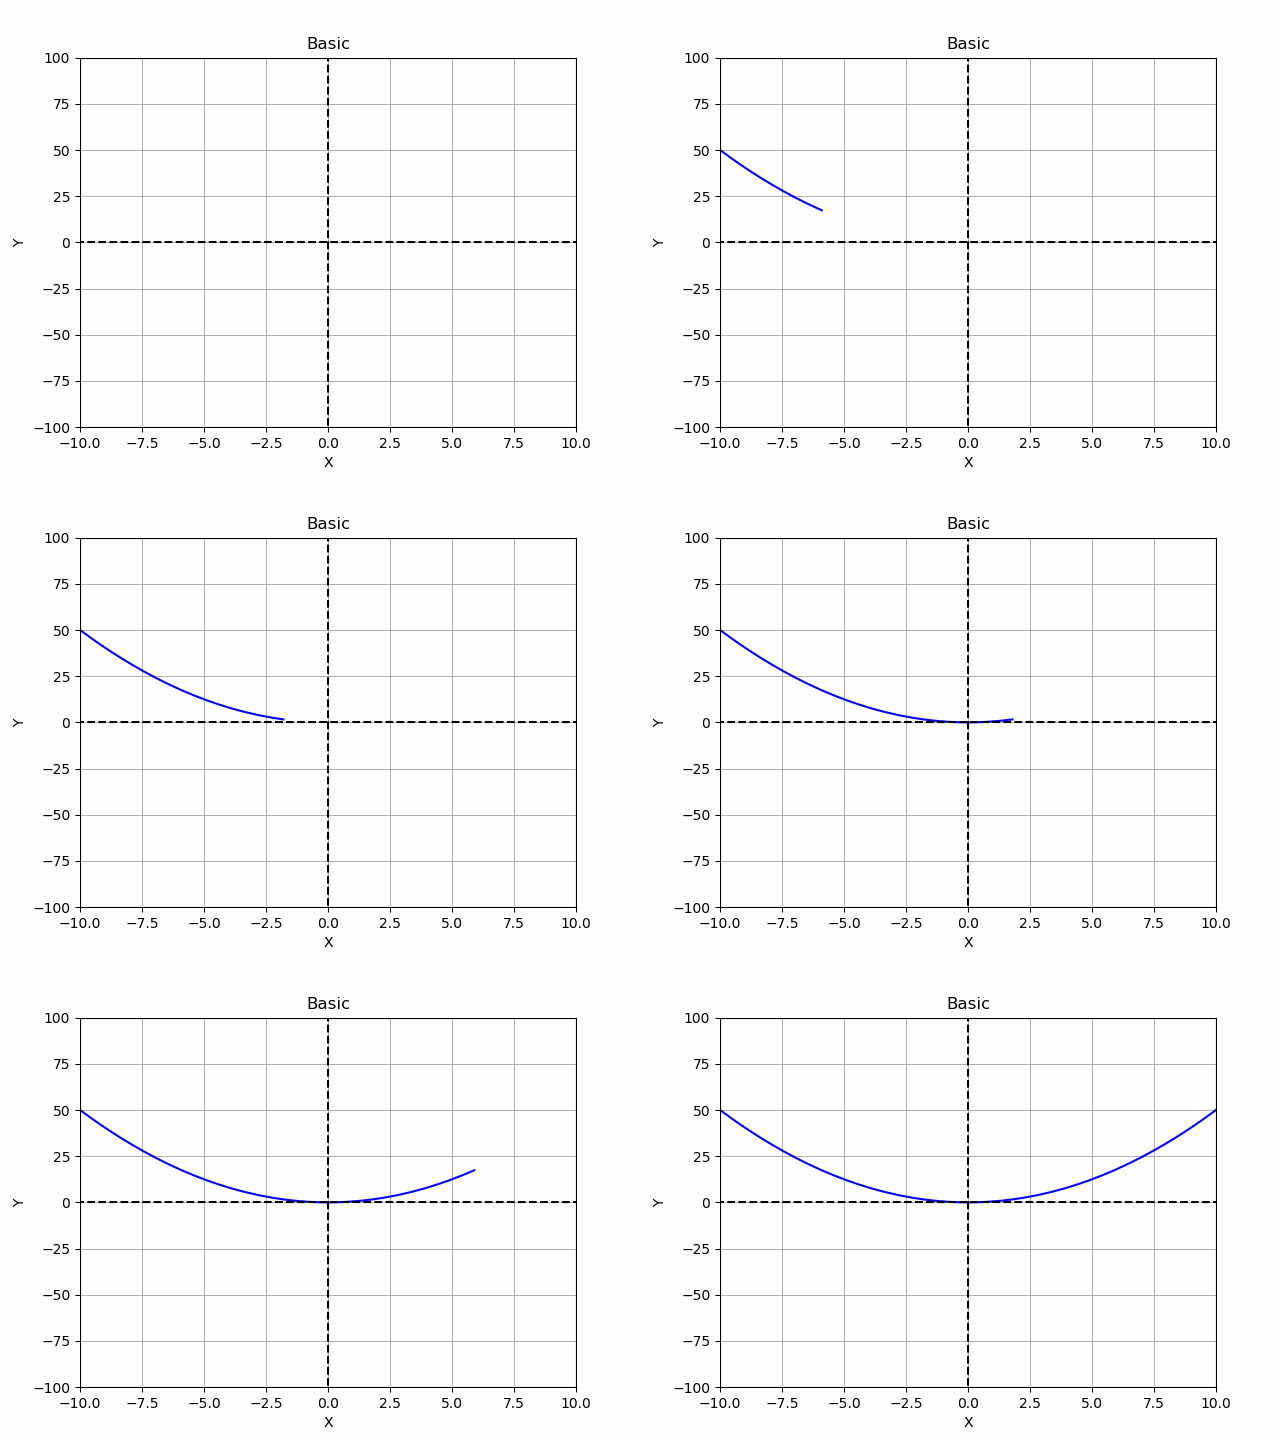
「y=ax²」のグラフを描いてみます。
モジュール
import numpy as np
import matplotlib.pyplot as plt
from matplotlib.animation import FuncAnimation
グラフ
%matplotlib nbagg
fig, ax = plt.subplots()
#y = ax^2
xdata, ydata = [], []
line, = plt.plot([], [], "b-") #*1
a = 1/2

def init():
    ax.set_title("Basic")

    ax.set_xlim(-10,10)
    ax.set_ylim(-100,100)
    #*2
    ax.axhline(y=0, xmin=-10, xmax=10, color="k", linestyle="--")
    ax.axvline(x=0, ymin=-100, ymax=100, color="k", linestyle="--")

    ax.set_xlabel("X")
    ax.set_ylabel("Y")
    ax.grid() #*3

    return line,

def update(frame):
    #y=ax^2
    xdata.append(frame)
    ydata.append(a*(frame)*(frame))
    line.set_data(xdata, ydata)

    return line,

ani = FuncAnimation(fig, update, frames=np.linspace(-10, 10, 40),
                    init_func=init, blit=True) #*4
plt.show()

#ani.save("XXX.gif", writer="pillow", fps=15)

Keys
1) "b-"⇒colorが「b(blue)」でlineが「-」です
2) axhline(y=Y, xmin=最小値, xmax=最大値)⇒y=Yで直線を引く
axvline(x=X, ymin=最小値, ymax=最大値)⇒x=Xで直線を引く
3) 図にグリッド欄を拭く
4) np.linspace(a, b, n)⇒初項a、末項bで、項数nの等差数列を作成
(e.g.)

np.linspace(0,20,20)
⇒array([ 0. , 1.05263158, 2.10526316, 3.15789474, 4.21052632,
 5.26315789, 6.31578947, 7.36842105, 8.42105263, 9.47368421,
 10.52631579, 11.57894737, 12.63157895, 13.68421053, 14.73684211,
 15.78947368, 16.84210526, 17.89473684, 18.94736842, 20. ])
Step3
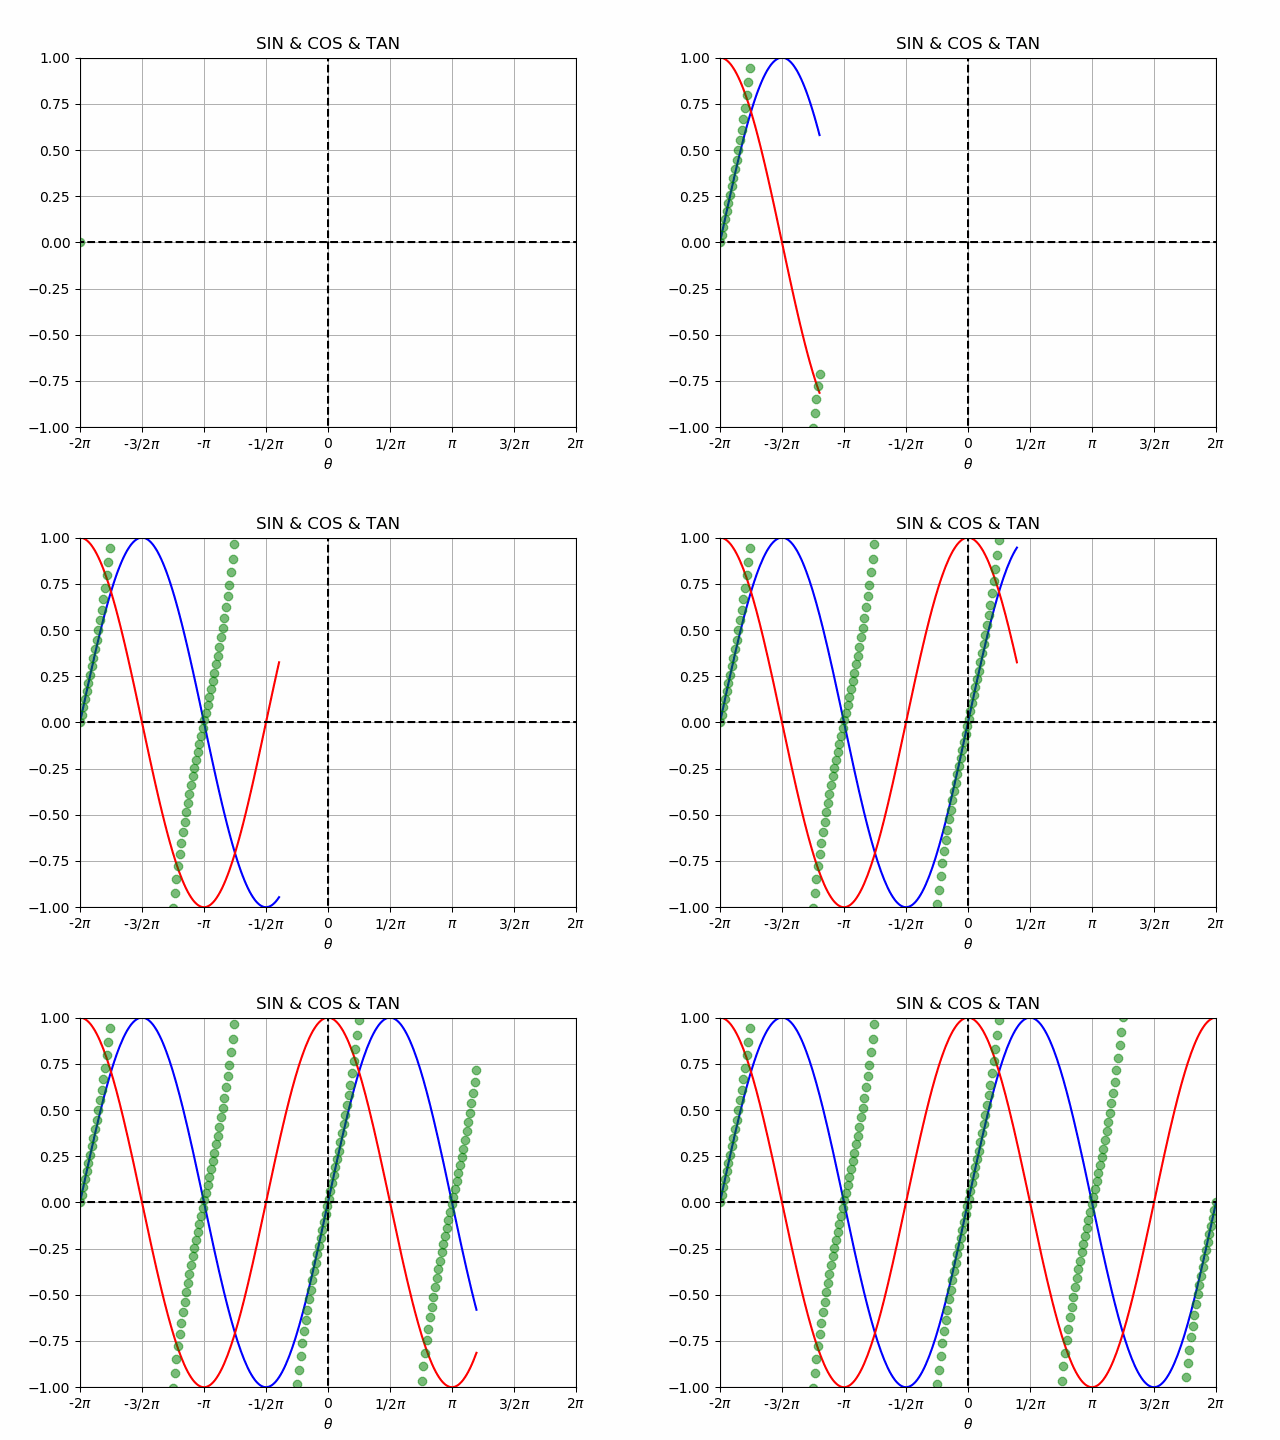
最後に複数の線をプロットしてみます
モジュール
import numpy as np
import matplotlib.pyplot as plt
from matplotlib.animation import FuncAnimation
グラフ
%matplotlib nbagg

fig, ax = plt.subplots()
#sin
xdata, ydata = [], []
ln, = plt.plot([], [], "b-")
#cos
xdata2, ydata2 = [], []
ln2, = plt.plot([], [], "r-")
#tan
xdata3, ydata3 = [], []
ln3, = plt.plot([], [], "go",alpha=0.5)

def init():
    ax.set_title("SIN & COS & TAN")

    ax.set_xlim(-2*np.pi, 2*np.pi)
    ax.set_ylim(-1, 1)
    ax.axhline(y=0, xmin=-2*np.pi, xmax=2*np.pi, color="k", linestyle="--")
    ax.axvline(x=0, ymin=-1, ymax=1, color="k", linestyle="--")

    ax.set_xticks(np.arange(-2*np.pi,2*np.pi+0.01,(1/2)*np.pi)) #*2
    ax.set_xticklabels(["-2$\pi$","-3/2$\pi$","-$\pi$","-1/2$\pi$", "0","1/2$\pi$","$\pi$","3/2$\pi$", "2$\pi$"]) #*1, 2
    ax.set_xlabel("$\\theta$") #*2
    ax.grid()

    return ln,

def update(frame):
    #sin
    xdata.append(frame)
    ydata.append(np.sin(frame))
    ln.set_data(xdata, ydata)
    #cos
    xdata2.append(frame)
    ydata2.append(np.cos(frame))
    ln2.set_data(xdata2, ydata2)
    #tan
    xdata3.append(frame)
    ydata3.append(np.tan(frame))
    ln3.set_data(xdata3, ydata3)

    return ln,ln2,ln3

ani = FuncAnimation(fig, update, frames=np.linspace(-2*np.pi, 2*np.pi, 300),
                    init_func=init, blit=True)
plt.show()

# ani.save("XXX.gif", writer="pillow", fps=15)

Keys
1)ラベルをラジアンに変換
2)ギリシャ文字
いかがだったでしょうか。
それでは🌏