【Science】 Matplotlibで振り子ー単振り子
こんにちは
今日は関数を使って、単振り子をアニメーションを作成したいと思います!
アニメーションの基礎は前の記事を参照してください!
微分方程式
単振り子を描写するのに関数が必要なので書き方を確認しましょう
モジュール
from scipy.integrate import solve_ivp
import matplotlib.pyplot as plt
import numpy as np
解く
それでは、solve_ivpで指数関数的減衰を解いてみます。
指数関数的減衰は半減期の計算で使われますね
https://www.nli-research.co.jp/report/detail/id=58700?site=nli
# 指数関数的減衰
def exponential_decay(t, y):
    return -0.5 * y

t_span = [0, 10] #tの範囲
y0 = [2, 4, 8] #y初期値
t_eval = np.arange(t_span[0], t_span[-1], 0.1) #tの間隔
sol = solve_ivp(exponential_decay, t_span, y0, t_eval=t_eval) #方程式を解く
解(sol)の中身を確認します。
print(sol.t)
⇒[0. 0.1 0.2 0.3…9.7 9.8 9.9]
print(sol.y)
⇒[[2. 1.90245885 1.809668…0.01492886 0.01420166]
 [4. 3.8049177 3.619336…0.02985772 0.02840332]
 [8. 7.6098354 7.238672…0.05971543 0.05680663]]
tに対するyが作成されていることがわかります。
描写
それでは描写してみます
fig, ax = plt.subplots()
ax.plot(sol.t, sol.y[0])
ax.plot(sol.t, sol.y[1])
ax.plot(sol.t, sol.y[2])

ax.set_xlabel("T")
ax.set_ylabel("Y-axis")

ax.set_xlim(t_span[0],t_span[-1])
ax.set_ylim(0, 9)

plt.show()

#保存
#fig.savefig("XXX.png", format="png", dpi=330)

単振り子
それでは単振り子のアニメーション作成してみます。
以下を参考に作成しました。
モジュール
まずはモジュールをインポートします
from scipy.integrate import solve_ivp
from matplotlib.animation import FuncAnimation
import matplotlib.pyplot as plt
import numpy as np
単振り子
%matplotlib nbagg
G = 9.8  # 重力加速度(m/s^2)
L = 1.0  # 振り子の長さ(m)

# 運動方程式を解く
def eom(t, state):
    dydt = np.zeros_like(state)
    dydt[0] = state[1]
    dydt[1] = -(G/L)*np.sin(state[0])
    return dydt

#設定
t_span = [0,20] #時間 (s)
dt = 0.05# 時間の間隔 (s)
t = np.arange(t_span[0], t_span[-1], dt)# 時間の間隔のarray作成

#初期状態設定
th1 = 45.0# 角度 [deg]
w1 = 0.0 # 初期角速度 [deg/s]
state = np.radians([th1, w1])# 初期状態

#微分方程式を解く
sol = solve_ivp(eom, t_span, state, t_eval=t)
theta = sol.y[0] #y[0]=θ、y[1]=ω

x = L * np.sin(theta)
y = -L * np.cos(theta)

#ーーーーーーグラフーーーーーーー
fig, ax = plt.subplots()

line, = ax.plot([], [], "o-", linewidth=2)
time_template = "time = %.1fs"
time_text = ax.text(0.05, 0.9, " ", transform=ax.transAxes)

def init():
    line.set_data([], [])
    time_text.set_text("")
    return line, time_text

def animate(i):
    thisx = [0, x[i]]
    thisy = [0, y[i]]
    line.set_data(thisx, thisy)
    time_text.set_text(time_template % (i*dt))
    return line, time_text


ani = FuncAnimation(fig, animate, frames=np.arange(0, len(t))
                    , interval=25, blit=True,init_func=init)

ax.set_xlim(-L-0.5,L+0.5)
ax.set_ylim(-L-0.5,L+0.5)
ax.set_aspect("equal")
ax.grid()

plt.show()

#ani.save("XXX.gif", writer="pillow", fps=20)
時間変化
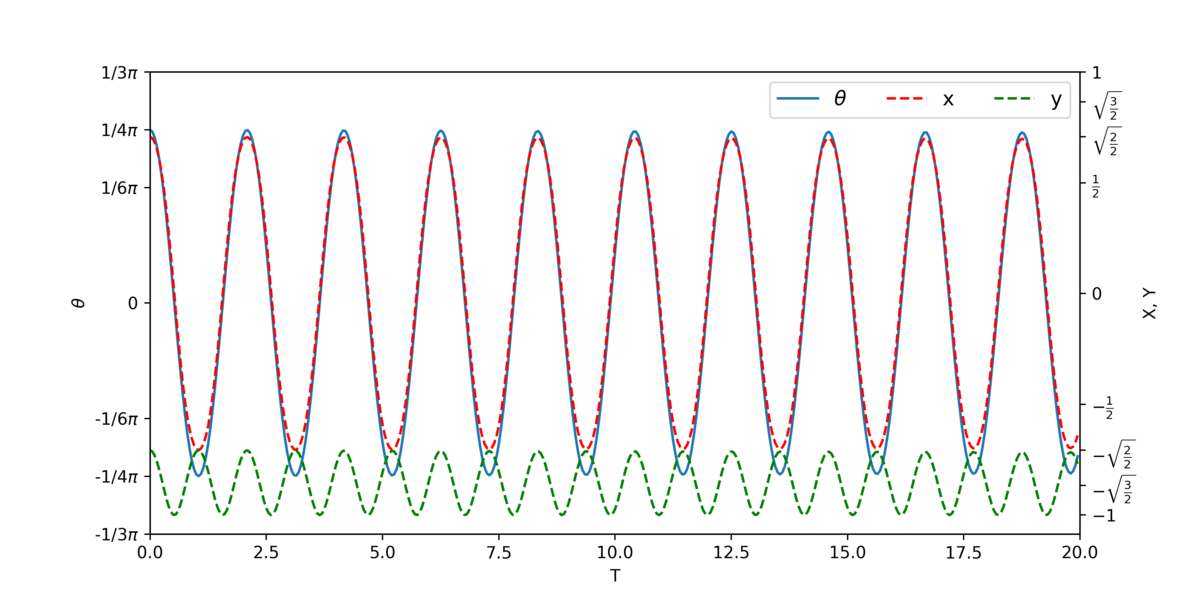
次に単振り子の角度、x, yの時間変化をプロットしてみます
fig = plt.figure(figsize=(10,5))
ax1 = plt.subplot(111)
ax2 = ax1.twinx()

ax1.plot(sol.t, sol.y[0], label="$\\theta$")
ax2.plot(sol.t, x , color="r", linestyle="--",label="x")
ax2.plot(sol.t, y , color="g", linestyle="--",label="y")

ax1.set_yticks(np.array([-np.pi, -(1/3)*np.pi, -(1/4)*np.pi, -(1/6)*np.pi, 0,(1/6)*np.pi,(1/4)*np.pi,(1/3)*np.pi,np.pi]))
ax1.set_yticklabels(["-$\pi$","-1/3$\pi$","-1/4$\pi$","-1/6$\pi$", "0","1/6$\pi$","1/4$\pi$","1/3$\pi$","$\pi$"])
ax1.set_ylabel("$\\theta$")
ax2.set_yticks(np.array([-1,-(1/2)*np.sqrt(3),-(1/2)*np.sqrt(2),-(1/2)*np.sqrt(1),0,(1/2)*np.sqrt(1),(1/2)*np.sqrt(2),(1/2)*np.sqrt(3),1]))
ax2.set_yticklabels(["$-$1","$-\sqrt{\\frac{3}{2}}$","$-\sqrt{\\frac{2}{2}}$","$-{\\frac{1}{2}}$", "0","${\\frac{1}{2}}$","$\sqrt{\\frac{2}{2}}$","$\sqrt{\\frac{3}{2}}$","1"])
ax2.set_ylabel("X, Y")
ax1.set_xlabel("T")

ax1.set_xlim(t_span[0],t_span[-1])
ax1.set_ylim(-(1/3)*np.pi,(1/3)*np.pi)

#凡例
h1, l1 = ax1.get_legend_handles_labels()
h2, l2 = ax2.get_legend_handles_labels()
ax1.legend(h1+h2, l1+l2, ncol=3, fontsize=12)

plt.show()

#保存
#fig.savefig("XXX.png", format="png", dpi=330)

単振り子の軌跡
%matplotlib nbagg
G = 9.8  # 重力加速度(m/s^2)
L = 1.0  # 振り子の長さ(m)

# 運動方程式を解く
def eom(t, state):
    dydt = np.zeros_like(state)
    dydt[0] = state[1]
    dydt[1] = -(G/L)*np.sin(state[0])
    return dydt

#設定
t_span = [0,20] #時間 (s)
dt = 0.05# 時間の間隔 (s)
t = np.arange(t_span[0], t_span[-1], dt)# 時間の間隔のarray作成

#初期状態設定
th1 = 45.0# 角度 [deg]
w1 = 0.0 # 初期角速度 [deg/s]
state = np.radians([th1, w1])# 初期状態

#微分方程式を解く
sol = solve_ivp(eom, t_span, state, t_eval=t)
theta = sol.y[0] #y[0]=θ、y[1]=ω

x = L * np.sin(theta)
y = -L * np.cos(theta)

#ーーーーーーグラフーーーーーーー
fig, ax = plt.subplots()

line, = ax.plot([], [], "o-", linewidth=2)
locus, = ax.plot([], [], 'r-', linewidth=2)
xlocus, ylocus = [], []
time_template = "time = %.1fs"
time_text = ax.text(0.05, 0.9, " ", transform=ax.transAxes)


def init():
    line.set_data([], [])
    time_text.set_text("")
    return line, time_text

def animate(i):
    thisx = [0, x[i]]
    thisy = [0, y[i]]
    line.set_data(thisx, thisy)
    xlocus.append(x[i])
    ylocus.append(y[i])

    locus.set_data(xlocus, ylocus)
    time_text.set_text(time_template % (i*dt))
    return line,xlocus, ylocus, time_text


ani = FuncAnimation(fig, animate, frames=np.arange(0, len(t))
                    , interval=25, blit=True,init_func=init)

ax.set_xlim(-L-0.5,L+0.5)
ax.set_ylim(-L-0.5,L+0.5)
ax.set_aspect("equal")
ax.grid()

plt.show()

#ani.save("XXX.gif", writer="pillow", fps=20)
複数の単振り子
次に複数の単振り子です。
%matplotlib nbagg
G = 9.8  # 重力加速度(m/s^2)
L = 1.0  # 振り子の長さ(m)

# 運動方程式を解く
def eom(t, state):
    dydt = np.zeros_like(state)
    dydt[0] = state[1]
    dydt[1] = -(G/L)*np.sin(state[0])
    return dydt

#設定
t_span = [0,20] #時間 (s)
dt = 0.05# 時間の間隔 (s)
t = np.arange(t_span[0], t_span[-1], dt)# 時間の間隔のarray作成

#初期状態設定

th1s = np.arange(40.0,90.0,10.0)
w1 = 0.0 # 初期角速度 [deg/s]

states=[]
for th1 in th1s:
    state = np.radians([th1, w1])# 初期状態
    states.append(state)

thetas=[]
for state in states:
    sol = solve_ivp(eom, t_span, state, t_eval=t)
    theta = sol.y[0] #y[0]=θ、y[1]=ω
    thetas.append(theta)

xs,ys=[],[]
for theta in thetas:
    x = L * np.sin(theta)
    y = -L * np.cos(theta)
    xs.append(x)
    ys.append(y)


#ーーーーーーグラフーーーーーーー
fig, ax = plt.subplots()

lines=[]
for i in range(len(th1s)):
    line, = ax.plot([], [], 'o-', lw=2, label=th1s[i])
    lines.append(line,)

time_template = "time = %.1fs"
time_text = ax.text(0.05, 0.9, " ", transform=ax.transAxes)


def init():
    for line in lines:
        line.set_data([], [])
    time_text.set_text("")
    return line, time_text

def animate(i):
    for j in range(len(lines)):
        line = lines[j]
        thisx = [0, xs[j][i]]
        thisy = [0, ys[j][i]]
        line.set_data(thisx, thisy)

    time_text.set_text(time_template % (i*dt))
    return line, time_text


ani = FuncAnimation(fig, animate, frames=np.arange(0, len(t))
                    , interval=25, blit=True,init_func=init)

ax.set_xlim(-L-0.5,L+0.5)
ax.set_ylim(-L-0.5,L+0.5)
ax.legend(title="init $\\theta$")
ax.set_aspect("equal")
ax.grid()

plt.show()

3ani.save("XXX.gif", writer="pillow", fps=20)
次は二重振り子によるカオスをアニメーションで描写したいと思います!
それでは🌏