【Matplotlib】エラーバーをfill_betweenで表示
こんにちは。
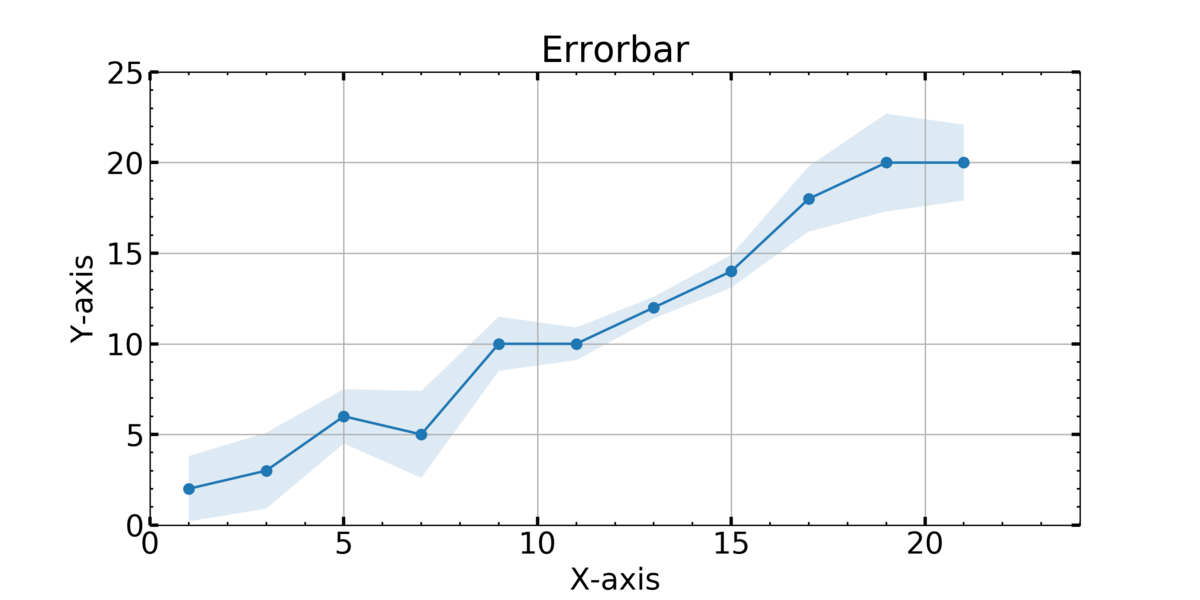
今日はエラーバーをfill_betweenを用いて表示してみたいと思います。
エラーバーと回帰直線の相関プロットについてです↓
使い方
x軸はxで、y1からy2の間を塗りつぶす
ax.fill_between(x, y1, y2)
例)y=0とy=x²の間を塗りつぶす
import numpy as np
import matplotlib.pyplot as plt
x = np.arange(-10, 10, 1)
y0 = x * 0
y = x ** 2

plt.fill_between(x, y0, y)

モジュール
まず必要なモジュールをインポートします。
import numpy as np
import matplotlib.pyplot as plt
描写
例1
まずは、1つのデータから描写します。
データは今回は適当なものを使います。
x = np.arange(1,23,2)
y = np.array([2,3,6,5,10,10,12,14,18,20,20])
#標準偏差を想定
y_err = np.array([0.6, 0.7, 0.5, 0.8, 0.5, 0.3, 0.2, 0.3, 0.6, 0.9, 0.7]) * 3
def main():
fig = plt.figure(figsize=(10,5))
plt.rcParams["font.size"] = 18

ax = plt.subplot(111)

ax.plot(x, y, marker="o")
ax.fill_between(x, y+y_err, y-y_err, alpha=0.15)


#範囲の設定
ax.set_xlim(0, 24)
ax.set_ylim(0, 25)

#メモリの設定
ax.minorticks_on() #補助メモリの描写
ax.tick_params(axis="both", which="major",direction="in",length=5,width=2,top="on",right="on")
ax.tick_params(axis="both", which="minor",direction="in",length=2,width=1,top="on",right="on")

#ラベルの設定
ax.set_title("Errorbar")
ax.set_xlabel("X-axis")
ax.set_ylabel("Y-axis")

ax.grid()

plt.show()

#保存
# fig.savefig("XXX.png",format="png", dpi=300)

if __name__ == "__main__":
    main()

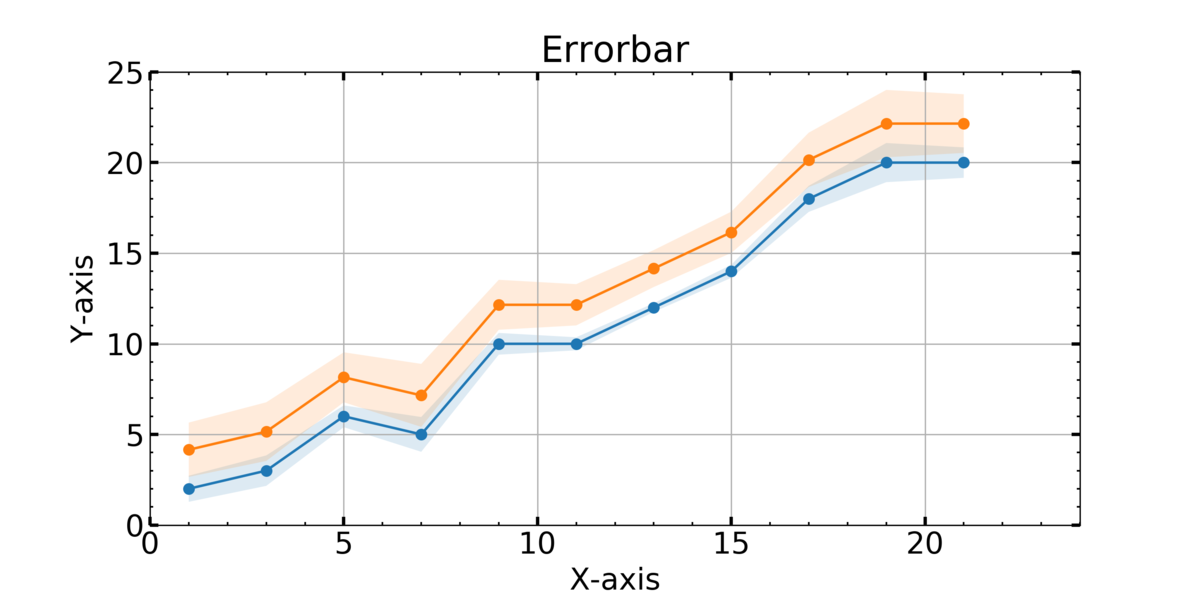
例2
例1のfill_betweenはalphaを設定すると、重なった部分がきれいに表示されます。
x = np.arange(1,23,2)
y1 = np.array([2,3,6,5,10,10,12,14,18,20,20])
y1_err = np.array([0.6, 0.7, 0.5, 0.8, 0.5, 0.3, 0.2, 0.3, 0.6, 0.9, 0.7]) * 1.2
y2 = y1 + np.random.rand() * 4
y2_err = y1_err + np.random.rand()
def main():
fig = plt.figure(figsize=(10,5))
plt.rcParams["font.size"] = 18

ax = plt.subplot(111)

ax.plot(x, y1, marker="o")
ax.fill_between(x, y1+y1_err, y1-y1_err, alpha=0.15)

ax.plot(x, y2, marker="o")
ax.fill_between(x, y2+y2_err, y2-y2_err, alpha=0.15)


#範囲の設定
ax.set_xlim(0, 24)
ax.set_ylim(0, 25)

#メモリの設定
ax.minorticks_on() #補助メモリの描写
ax.tick_params(axis="both", which="major",direction="in",length=5,width=2,top="on",right="on")
ax.tick_params(axis="both", which="minor",direction="in",length=2,width=1,top="on",right="on")

#ラベルの設定
ax.set_title("Errorbar")
ax.set_xlabel("X-axis")
ax.set_ylabel("Y-axis")

ax.grid()

plt.show()


#保存
# fig.savefig("XXX.png",format="png", dpi=300)

if __name__ == "__main__":
    main()
