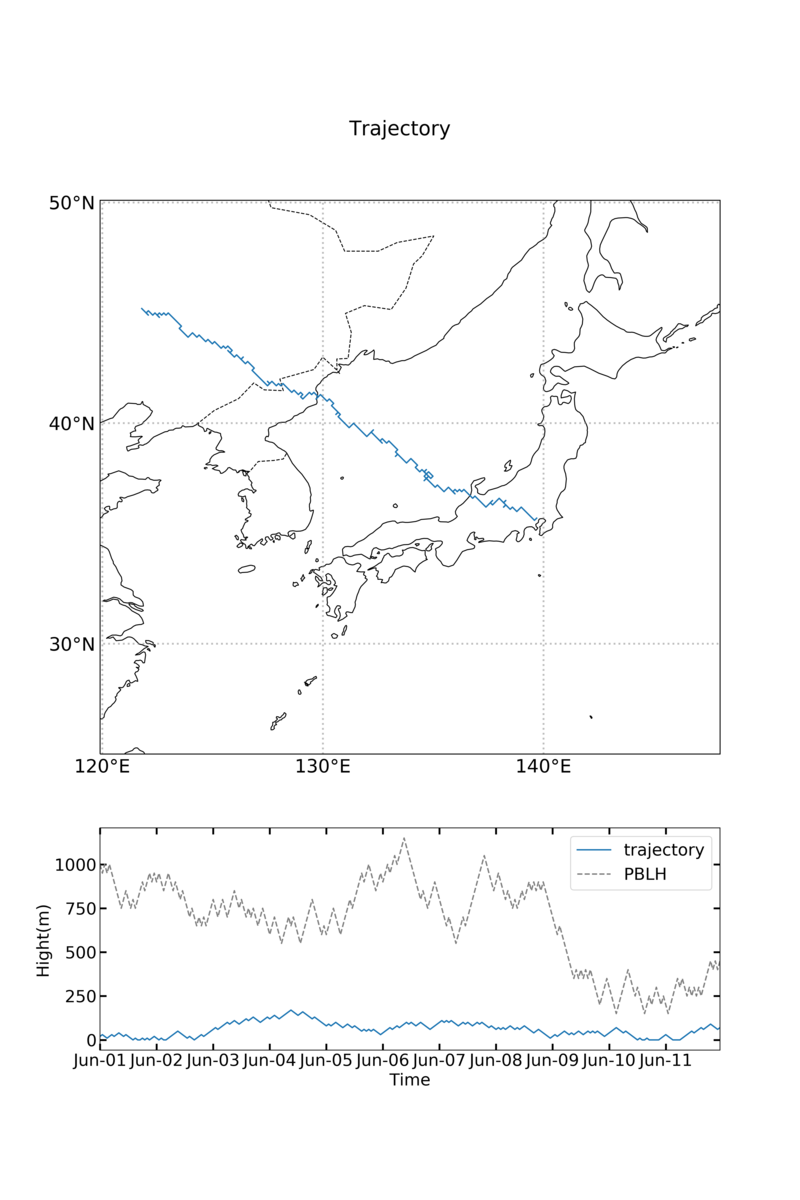
【Matplotlib 】Python Matplotlibでトラジェクトリー描写
こんにちは。今日はトラジェクトリーのデータを高度分布とともにプロットする方法です。
データは各自でご用意ください。
必要な知識
Matplotlibの基礎
Python-時系列プロット(気温ー日平均) - RuntaScience diary
Python 軸を日付フォーマットに変更 - RuntaScience diary
グラフ分割の基礎
Python matplotlibのGridspecーグラフの柔軟な分割(3:1でもで4:1でも) - RuntaScience diary
PBLH
Planetary Boundary Layer Height;大気境界層高度
大気境界層(地表面の影響を受ける層で、地上から1ー3 kmの層)と自由大気層(その影響がない)の境界
データ
始める前にデータをインポートしてください。
データフレーム(df)でもarrayでも大丈夫です。
必要なのは、緯度経度のデータ・時間のデータ・高度のデータです。
今回私は適当に作成したエクセルファイルをdfに入れて使います。
| Time | latitude | longitude | hight | pblh | |
|---|---|---|---|---|---|
| 0 | 2020-06-01 00:00:00 | 35.68944 | 139.69167 | 20 | 1000 |
| 1 | 2020-06-01 01:00:00 | 35.58944 | 139.59167 | 30 | 950 |
| 2 | 2020-06-01 02:00:00 | 35.68944 | 139.49167 | 20 | 1000 |
| 3 | 2020-06-01 03:00:00 | 35.78944 | 139.39167 | 10 | 950 |
| 4 | 2020-06-01 04:00:00 | 35.88944 | 139.29167 | 20 | 1000 |
| ... | ... | ... | ... | ... | ... |
| 259 | 2020-06-11 19:00:00 | 44.98944 | 121.99167 | 90 | 450 |
| 260 | 2020-06-11 20:00:00 | 44.88944 | 122.09167 | 80 | 400 |
| 261 | 2020-06-11 21:00:00 | 44.98944 | 121.99167 | 70 | 450 |
| 262 | 2020-06-11 22:00:00 | 45.08944 | 121.89167 | 60 | 400 |
| 263 | 2020-06-11 23:00:00 | 45.18944 | 121.79167 | 70 | 450 |
モジュール
まずは必要なモジュールをインポートします。
import matplotlib.pyplot as plt #描写
from matplotlib import gridspec #グラフ分割のため
#cartopy
import cartopy.crs as ccrs
import matplotlib.ticker as mticker #緯度経度グリッド作成のため
from cartopy.mpl.gridliner import LONGITUDE_FORMATTER, LATITUDE_FORMATTER #緯度経度線を度数表示にするため
import cartopy.feature as cfeature #国境線引くため

import numpy as np #数値計算
import pandas as pd #データ読み込み用

#時間軸作成のため
from matplotlib import dates as mdates
from matplotlib.dates import DateFormatter
import datetime
描写
#グラフ
fig = plt.figure(figsize=(12,18))
gs = gridspec.GridSpec(2, 1, height_ratios=(3, 1)) #*1
plt.rcParams["font.size"] = 18 #*2
plt.suptitle("Trajectory", y=0.9) #3

#上図
ax1=fig.add_subplot(gs[0:1, :], projection=ccrs.PlateCarree()) #1
ax1.coastlines(resolution="50m")


 #緯度・経度線のグリッドの設定 #4
gl = ax1.gridlines(crs=ccrs.PlateCarree(), draw_labels=True,
              linewidth=2, color="gray", alpha=0.5, linestyle=":")
gl.xlabels_top = False
gl.ylabels_right = False
dlon, dlat = 10,10
xticks = np.arange(-180, 180.1, dlon)
yticks = np.arange(-90, 90.1, dlat)
gl.xlocator = mticker.FixedLocator(xticks)
gl.ylocator = mticker.FixedLocator(yticks)
gl.xformatter = LONGITUDE_FORMATTER
gl.yformatter = LATITUDE_FORMATTER
gl.xlabel_style = {"size": 20}
gl.ylabel_style = {"size": 20}


ax1.add_feature(cfeature.BORDERS, linestyle="--", linewidth=1) #国境線

lon = df["longitude"]
lat = df["latitude"]
ax1.plot(lon,lat)
#上グラフの範囲([経度min, 経度max, 緯度min, 緯度max])
ax1.set_extent([119.9, 148, 25, 50.1], crs=ccrs.PlateCarree())


#目盛りの表示形式を度数表記に
ax1.xaxis.set_major_formatter(LongitudeFormatter(zero_direction_label=True))
ax1.yaxis.set_major_formatter(LatitudeFormatter())
#===============================================================================
# 下のグラフ
ax2=fig.add_subplot(gs[-1, :]) #1


t = df["Time"]
h=df["hight"]
ax2.plot(t,h,label="trajectory")

pblh=df["pblh"]
ax2.plot(t,pblh,"--",label="PBLH",color="gray")

#軸の設定 #*5
ax2.set_xlim(t.min(), t.max())
ax2.tick_params(axis="both", which="major",direction="in",length=7,width=2,top="on",right="on")
ax2.xaxis.set_major_formatter(DateFormatter("%b-%d"))
ax2.xaxis.set_major_locator(mdates.DayLocator(interval=1))

#ラベル
ax2.set_xlabel("Time")
ax2.set_ylabel("Hight(m)")
ax2.legend()

#グラフ間の隙間 #6
plt.subplots_adjust(hspace=0.04)

plt.show()


fig.savefig("XXX.png", format="png",dpi=330)

Keys
1) グラフ分割:縦を3:1の2つに分割、横は1
2) 一括でフォントサイズ設定
3) 全体のタイトル。yで縦方向の位置を設定
4)詳しくは
Cartopy-Pythonを用いた、Merra-2の利用 - RuntaScience diary
5)詳しくは
Python-時系列プロット(気温ー日平均) - RuntaScience diary
6)hspaceで上下のスペース、wspaceで左右のスペース
それでは 🌏